This is a comprehensive description of a powerful technical analysis tool designed to bridge the gap between "retail" trading (individual traders) and "institutional" trading (banks and hedge funds).
Below is a structured breakdown of the concepts and features mentioned in your text, organized to help you understand how this indicator visualizes market behavior.
1. The Core Philosophy: Smart Money Concepts (SMC)
The logic behind this indicator is based on Inner Circle Trader (ICT) teachings. The central premise is that the market is not random; it is manipulated and moved by large amounts of capital (Smart Money).
* The Goal: To stop trading against the "big players" and start trading with them.
* The Method: Tracking footprints left by large orders (Order Blocks, Imbalances) to predict where price will go next.
2. Key Features Explained
Here is how the specific features of this indicator function to help you read the chart.
A. Market Structure (Swing Structure)
This maps the "skeleton" of the market. It identifies the trend by marking the highs and lows.
* Uptrend: Consists of Higher Highs (HH) and Higher Lows (HL).
* Downtrend: Consists of Lower Lows (LL) and Lower Highs (LH).
B. Break of Structure (BOS) vs. Change of Character (CHoCH)
The indicator automates the identification of trend continuations and reversals.
* BOS (Break of Structure): This happens when price breaks a previous high in an uptrend (or low in a downtrend), signaling that the trend is continuing.
* CHoCH (Change of Character): This is the first sign of a reversal. It happens when price breaks the last valid higher low in an uptrend (or lower high in a downtrend). It signals a shift from bullish to bearish (or vice versa).
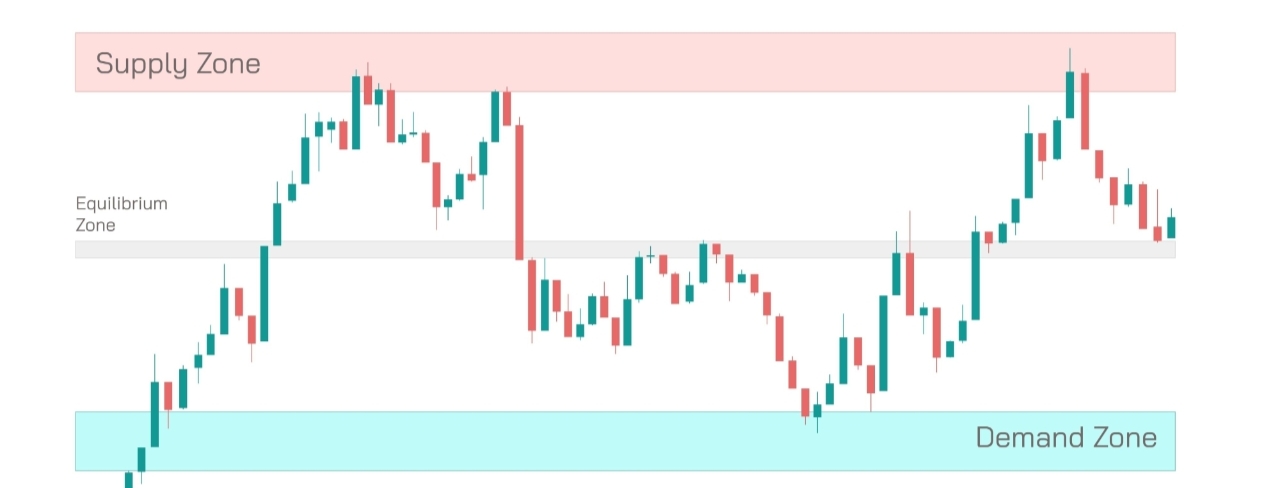
C. Premium & Discount Zones
Institutional algorithms generally buy at a discount and sell at a premium. This feature uses the Fibonacci principle (usually the 50% level of a range).
* Current Trading Range: The distance between the current Swing High and Swing Low.
* Premium (Upper 50%): Expensive prices. Look for Short/Sell setups here.
* Discount (Lower 50%): Cheap prices. Look for Long/Buy setups here.
* EQ (Equilibrium): The exact middle (50%).
D. Supply, Demand & Order Blocks
* Order Block (OB): Specific candles where institutions initiated a strong move. When price returns to these blocks, they often act as strong support or demand.
* Imbalance / FVG (Fair Value Gap): An area where price moved so fast that it left inefficient pricing. Price often acts like a magnet to return to these areas to "fill" the gap.
3. Terminology Decoder
The list of abbreviations you provided is extensive. Here they are categorized for easier reference:
Market Structure & Trend
| Acronym | Full Name | Meaning |
|---|---|---|
| HH / HL | Higher High / Higher Low | Components of an Uptrend. |
| LH / LL | Lower High / Lower Low | Components of a Downtrend. |
| BOS / BMS | Break of Structure | Trend continuation signal. |
| CHoCH | Change of Character | Trend reversal signal. |
| SMS | Shift in Market Structure | Similar to CHoCH; a sign the trend is failing. |
| PT / CT | Pro-Trend / Counter-Trend | Trading with the flow vs. against it. |
Liquidity & Zones (Where to Trade)
| Acronym | Full Name | Meaning |
|---|---|---|
| OB | Orderblock | Footprint of institutional buying/selling. |
| POI / AOI | Point/Area of Interest | A zone where you are watching for a trade entry. |
| FVG / IMB | Fair Value Gap / Imbalance | A gap in price action that often gets filled. |
| EQH / EQL | Equal Highs / Lows | Areas with high liquidity (stops sitting above/below). |
| BSL / SSL | Buy/Sell Side Liquidity | Pending orders sitting above highs or below lows. |
| S&D | Supply & Demand | Broad term for zones where price reacts. |
Time & Execution
| Acronym | Full Name | Meaning |
|---|---|---|
| HTF / LTF | High / Low Timeframe | e.g., using 4H for direction and 15m for entry. |
| HOD / LOD | High / Low of Day | often acts as a magnet or support/resistance. |
| RR | Risk to Reward | The ratio of money risked vs. potential profit. |
| SL | Stop Loss | Your exit point if the trade fails. |
4. How to Apply This (Standard SMC Workflow)
If you are setting up this indicator, a standard workflow would look like this:
* Check HTF Structure: Look at the Swing Structure lines. Are you making HHs or LLs?
* Identify Range: Look at the Current Trading Range. Is price in the Premium (Red) or Discount (Green) zone?
* Find the POI: Look for an Order Block or Supply/Demand zone within that Premium/Discount area.
* Wait for Trigger: Watch for a CHoCH (Change of Character) on a Lower Timeframe (LTF) inside your POI to confirm the entry.
Next Step
This is a very sophisticated toolset. Would you like me to create a specific "Checklist" for taking a Long (Buy) or Short (Sell) trade using these specific indicators?